THE QUICK ANSWER
China exported $963m of goods under HS 4201 in 2025, down from a peak of $1,368m in 2022 but 41% above 2019. The United States took 32.1%, down from 42.3% in 2019, followed by Germany (8.6%), the United Kingdom (6.9%), Japan (5.6%), the Netherlands (3.7%) and Australia (3.4%). China’s own figure for exports to the US ($309m in 2025) is now more than twice the US figure for imports from China ($133m).
THE NUMBERS
- $963m
- China’s exports under HS 4201 in 2025, against a peak of $1,368m in 2022. UN Comtrade
- 42.3% → 32.1%
- the United States’ share of those exports, 2019 to 2025. UN Comtrade
- 8.6% · 6.9% · 5.6%
- Germany, the United Kingdom and Japan in 2025, the next three markets. UN Comtrade
- $309m vs $133m
- China’s reported exports to the US against US-reported imports from China, 2025. UN Comtrade
Share of China’s exports under HS 4201, by destination
- United States 32.1% in 2025
- Germany 8.6% in 2025
- United Kingdom 6.9% in 2025
- Japan 5.6% in 2025
What the export figure covers
These are exports reported by China, by destination. UN Comtrade records exports free on board, without the freight and insurance that import figures include, and a destination is the country the goods were declared as leaving for, which is not always where they are finally sold. HS 4201 is the international customs heading for “saddlery and harness for any animal (including traces, leads, knee pads, muzzles, saddle cloths, saddle bags, dog coats and the like), of any material”. It is the closest heading to dog walking gear that every country reports in the same way, which is why it is used here. It also covers saddlery and harness for horses and other animals, so read the figures as walking gear plus tack, not as dog products alone. National tariff schedules split dog equipment into their own lines below the six-digit level, but those lines are not comparable between countries.
Seven years of exports
China’s exports under HS 4201 were $682m in 2019 and $805m in 2020, then rose to $1,334m in 2021 and $1,368m in 2022. They fell to $1,182m in 2023, $1,117m in 2024 and $963m in 2025, still 41% above the 2019 level. Monthly figures for 2026 were not yet published in UN Comtrade when this report was compiled.
Where it goes
The United States took 42.3% of exports in 2019 and 32.1% in 2025, $309m in dollars. Next came Germany ($83m), the United Kingdom ($66m), Japan ($54m), the Netherlands ($36m), Australia ($32m) and Canada ($29m). Malaysia rose from 0.5% in 2019 to 5.1% in 2023 before falling back to 2.3% in 2025.
When the two sides disagree
In 2019 the US recorded $339m of imports from China under HS 4201 and China recorded $289m of exports to the US, the expected order, since import values include freight and insurance. By 2025 the US figure was $133m and China’s $309m. The World Bank’s guide to UN Comtrade lists the usual reasons the two sides of the same trade differ: imports are valued with freight and insurance and exports without, data quality varies between countries, imports tend to be recorded more accurately because they carry duties, and the same goods can be classified differently by the exporter and the importer. The data does not show which of these applies here, so for a market’s own sourcing pattern, use that market’s import figures.
How the figures were built
We retrieved UN Comtrade records for HS 4201 with China as reporter and exports as the flow, partner by partner, for each year from 2019 to 2025, and US imports from China for the comparison. A share is the partner’s value divided by the world total reported for the same year. To check a figure, query the UN Comtrade Database for commodity 4201, reporter China, flow export, all partners and the year in question.
What it means for buyers outside the US
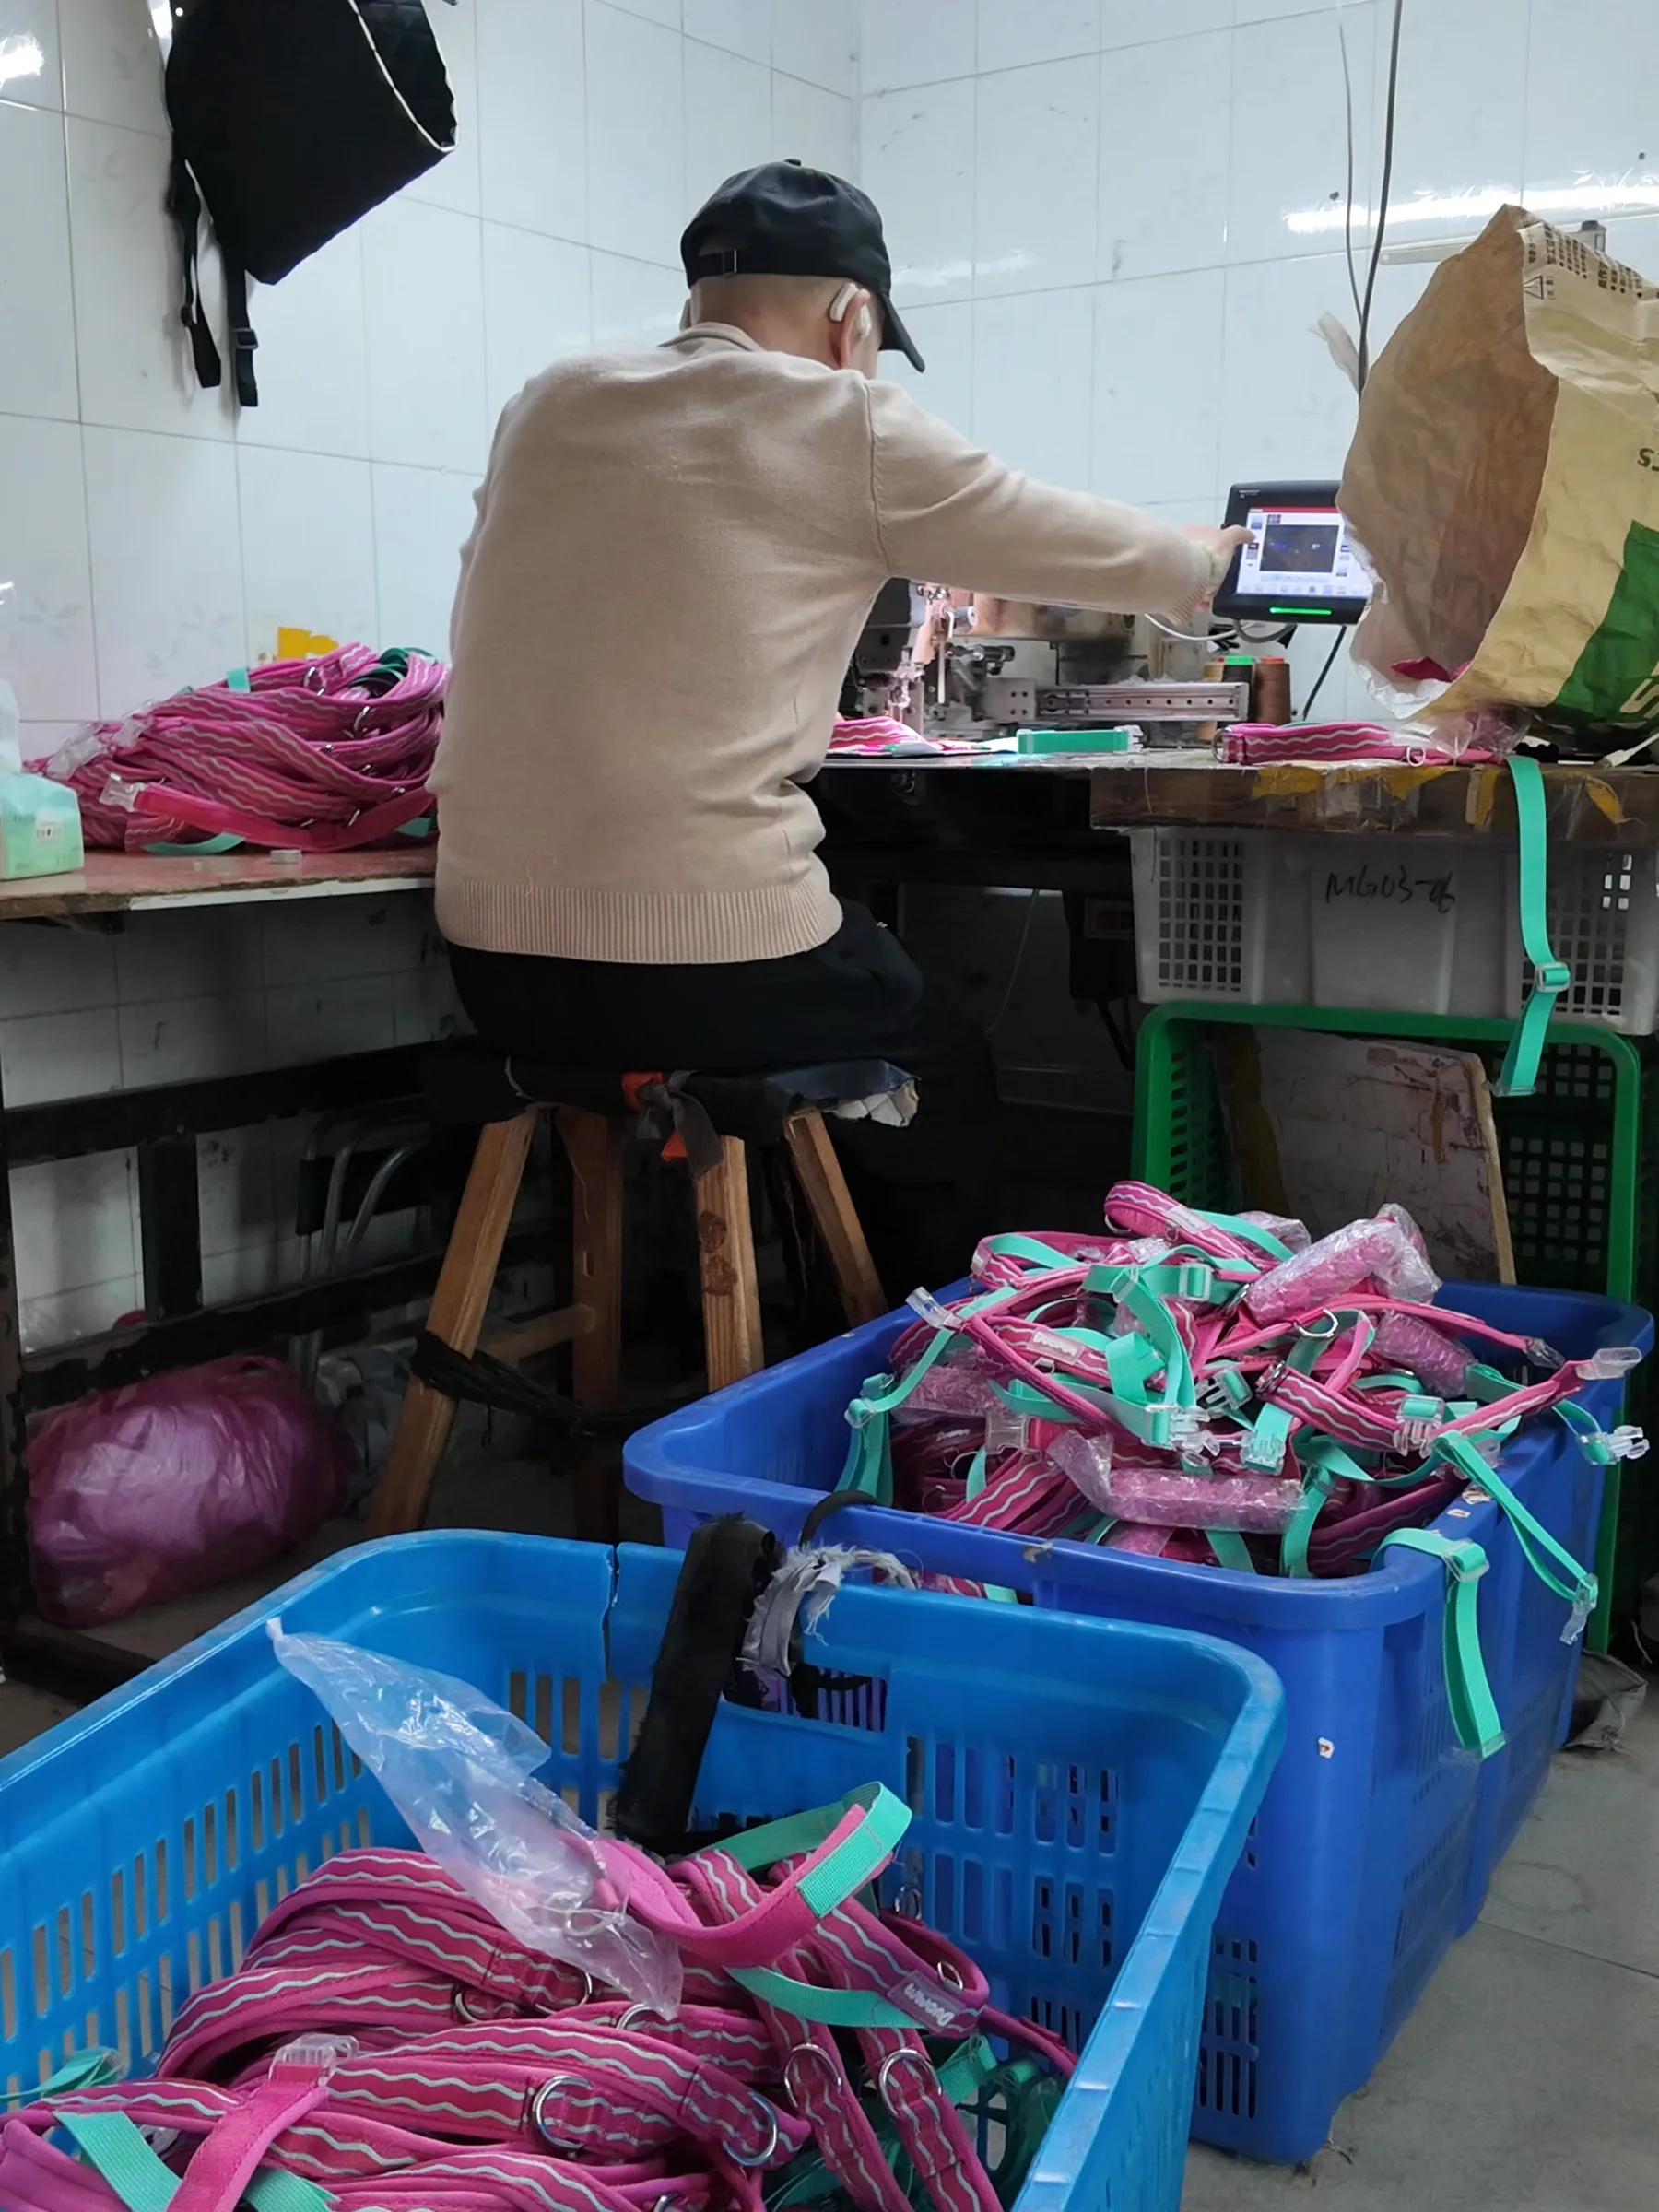
China remains the main source of this category for Germany, the United Kingdom, Japan, the Netherlands, Australia and Canada. For a brand in any of those markets, the practical questions are the same as anywhere: which facility makes the product, which country it is declared from, which product rules the target market applies, and what the landed cost is at the planned quantity. Catidog quotes from China at a typical 100–500 units per product and names the producing facility in each quotation.
China’s exports under HS 4201: total and share by destination
| Year | China exports (US$ m) | United States | Germany | United Kingdom | Japan |
|---|---|---|---|---|---|
| 2019 | 682.5 | 42.3% | 8.9% | 7.9% | 5.8% |
| 2020 | 804.6 | 41.3% | 7.7% | 7.7% | 5.3% |
| 2021 | 1,334.2 | 38.2% | 7.6% | 8.4% | 4.4% |
| 2022 | 1,368.2 | 37.1% | 6.6% | 6.5% | 4.4% |
| 2023 | 1,181.6 | 33.0% | 5.9% | 7.1% | 4.4% |
| 2024 | 1,116.9 | 32.2% | 7.2% | 7.0% | 4.8% |
| 2025 | 962.8 | 32.1% | 8.6% | 6.9% | 5.6% |
Products in this customs heading.
No-pull dog harness — materials, customization and sample checks Standard dog leash — materials, customization and sample checks Adjustable webbing collar — materials, customization and sample checks Dog winter coat — materials, customization and sample checksSources and research context
Figures are official trade statistics as reported to UN Comtrade. Totals and shares are our calculation from those records; no raw records are republished.
- United Nations Statistics Division · UN Comtrade Database · HS 4201, exports reported by China, by partner: annual 2019–2025 (retrieved 9 October 2026)
- United Nations Statistics Division · UN Comtrade Database · HS 4201, imports reported by the USA, by partner: annual 2019–2025 and monthly January–July 2025 and 2026 (retrieved 9 October 2026)
- World Bank · WITS online help: imports, exports and mirror data with UN Comtrade
- Japan Customs · Tariff schedule as of 1 April 2026, chapter 42: heading 42.01, “Saddlery and harness for any animal”
TURN THE ANSWER INTO AN OEM BRIEF