THE QUICK ANSWER
In 2025 the United States imported $513m of goods under HS 4201, the customs heading for leads, collars, harnesses, muzzles and dog coats as well as saddlery for other animals. China supplied 25.9%, down from 64.8% in 2019; Cambodia rose from 0.5% to 20.0% and Vietnam from 4.4% to 18.1%. In January–July 2026 imports were 1.4% above the same months of 2025, and China’s share was 25.5%.
THE NUMBERS
- $513m
- US imports under HS 4201 in 2025, against a peak of $816m in 2022. UN Comtrade
- 64.8% → 25.9%
- China’s share of those imports, 2019 to 2025. UN Comtrade
- 20.0% + 18.1%
- Cambodia and Vietnam in 2025, up from 4.9% together in 2019. UN Comtrade
- +1.4%
- January–July 2026 against the same months of 2025; China held 25.5%. UN Comtrade
Share of US imports under HS 4201, by country of origin
- China 25.9% in 2025
- Cambodia 20% in 2025
- Vietnam 18.1% in 2025
- India 11.1% in 2025
What HS 4201 covers
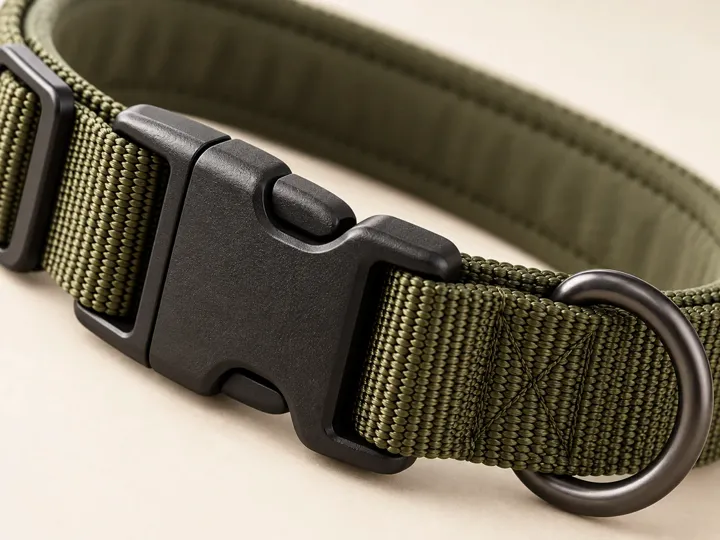
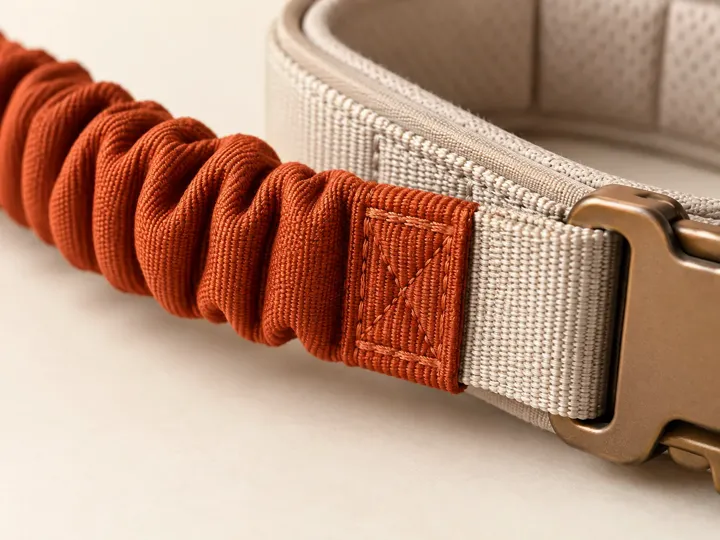
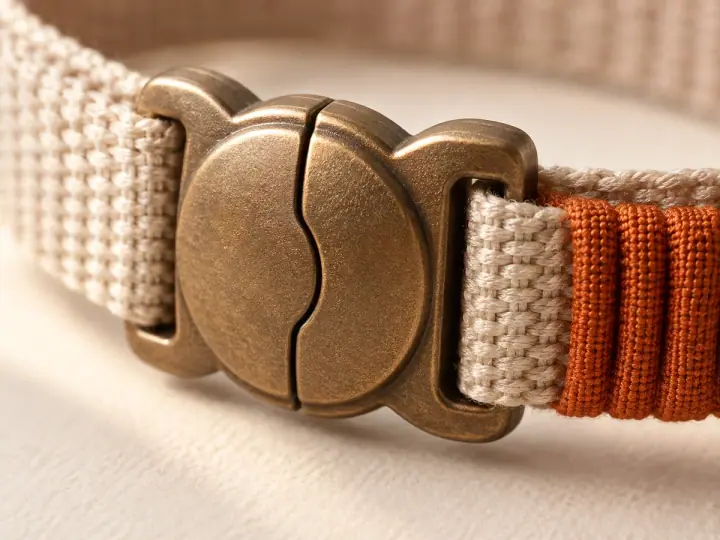
HS 4201 is the international customs heading for “saddlery and harness for any animal (including traces, leads, knee pads, muzzles, saddle cloths, saddle bags, dog coats and the like), of any material”. It is the closest heading to dog walking gear that every country reports in the same way, which is why it is used here. It also covers saddlery and harness for horses and other animals, so read the figures as walking gear plus tack, not as dog products alone. National tariff schedules split dog equipment into their own lines below the six-digit level, but those lines are not comparable between countries.
Seven years of US imports
US imports under HS 4201 were $523m in 2019 and $527m in 2020, jumped to $767m in 2021 and peaked at $816m in 2022. They fell to $578m in 2023, held at $591m in 2024 and eased to $513m in 2025, just below the 2019 level. The data records value in US dollars, not units, so it cannot separate a change in prices from a change in volume.
Where the share went
China supplied 64.8% of the 2019 total and 25.9% of the 2025 total, with a lower share in every year between. Cambodia went from 0.5% to 20.0% and Vietnam from 4.4% to 18.1%. In dollars, the 2025 split was China $133m, Cambodia $102m, Vietnam $93m and India $57m. India held between 7.7% and 11.1% throughout, Mexico rose from 3.2% to 4.2%, and France and Germany each stayed between about 3% and 5%.
2026 so far
Monthly records for January to July 2026 add up to $284m of imports, 1.4% more than the $280m recorded for the same months of 2025. China’s share was 25.5%, against 27.0% a year earlier; Cambodia held 18.3%, Vietnam 18.2% and India 9.7%. Seven months is not a trend, but it shows the 2025 split holding rather than reversing.
How the figures were built
We retrieved UN Comtrade records for HS 4201 with the USA as reporter and imports as the flow, partner by partner, for each year from 2019 to 2025 and for each month from January to July of 2025 and 2026. A share is the partner’s value divided by the world total reported for the same period. Values are in US dollars as published, rounded to the nearest million in the text and to 0.1 million in the table; shares are rounded to 0.1 percentage point. To check a figure, query the UN Comtrade Database for commodity 4201, reporter USA, flow import, all partners and the period in question.
What the data cannot tell you
Trade statistics record what was declared at the border. They show which country the goods were recorded as coming from, not who designed them, which brand sold them or where each component was made, and they do not explain why sourcing moved. UN Comtrade records imports at cost, insurance and freight, its USA figures include Puerto Rico and the US Virgin Islands, and recent months can be revised. The heading also includes saddlery for other animals.
What it means for a private-label buyer
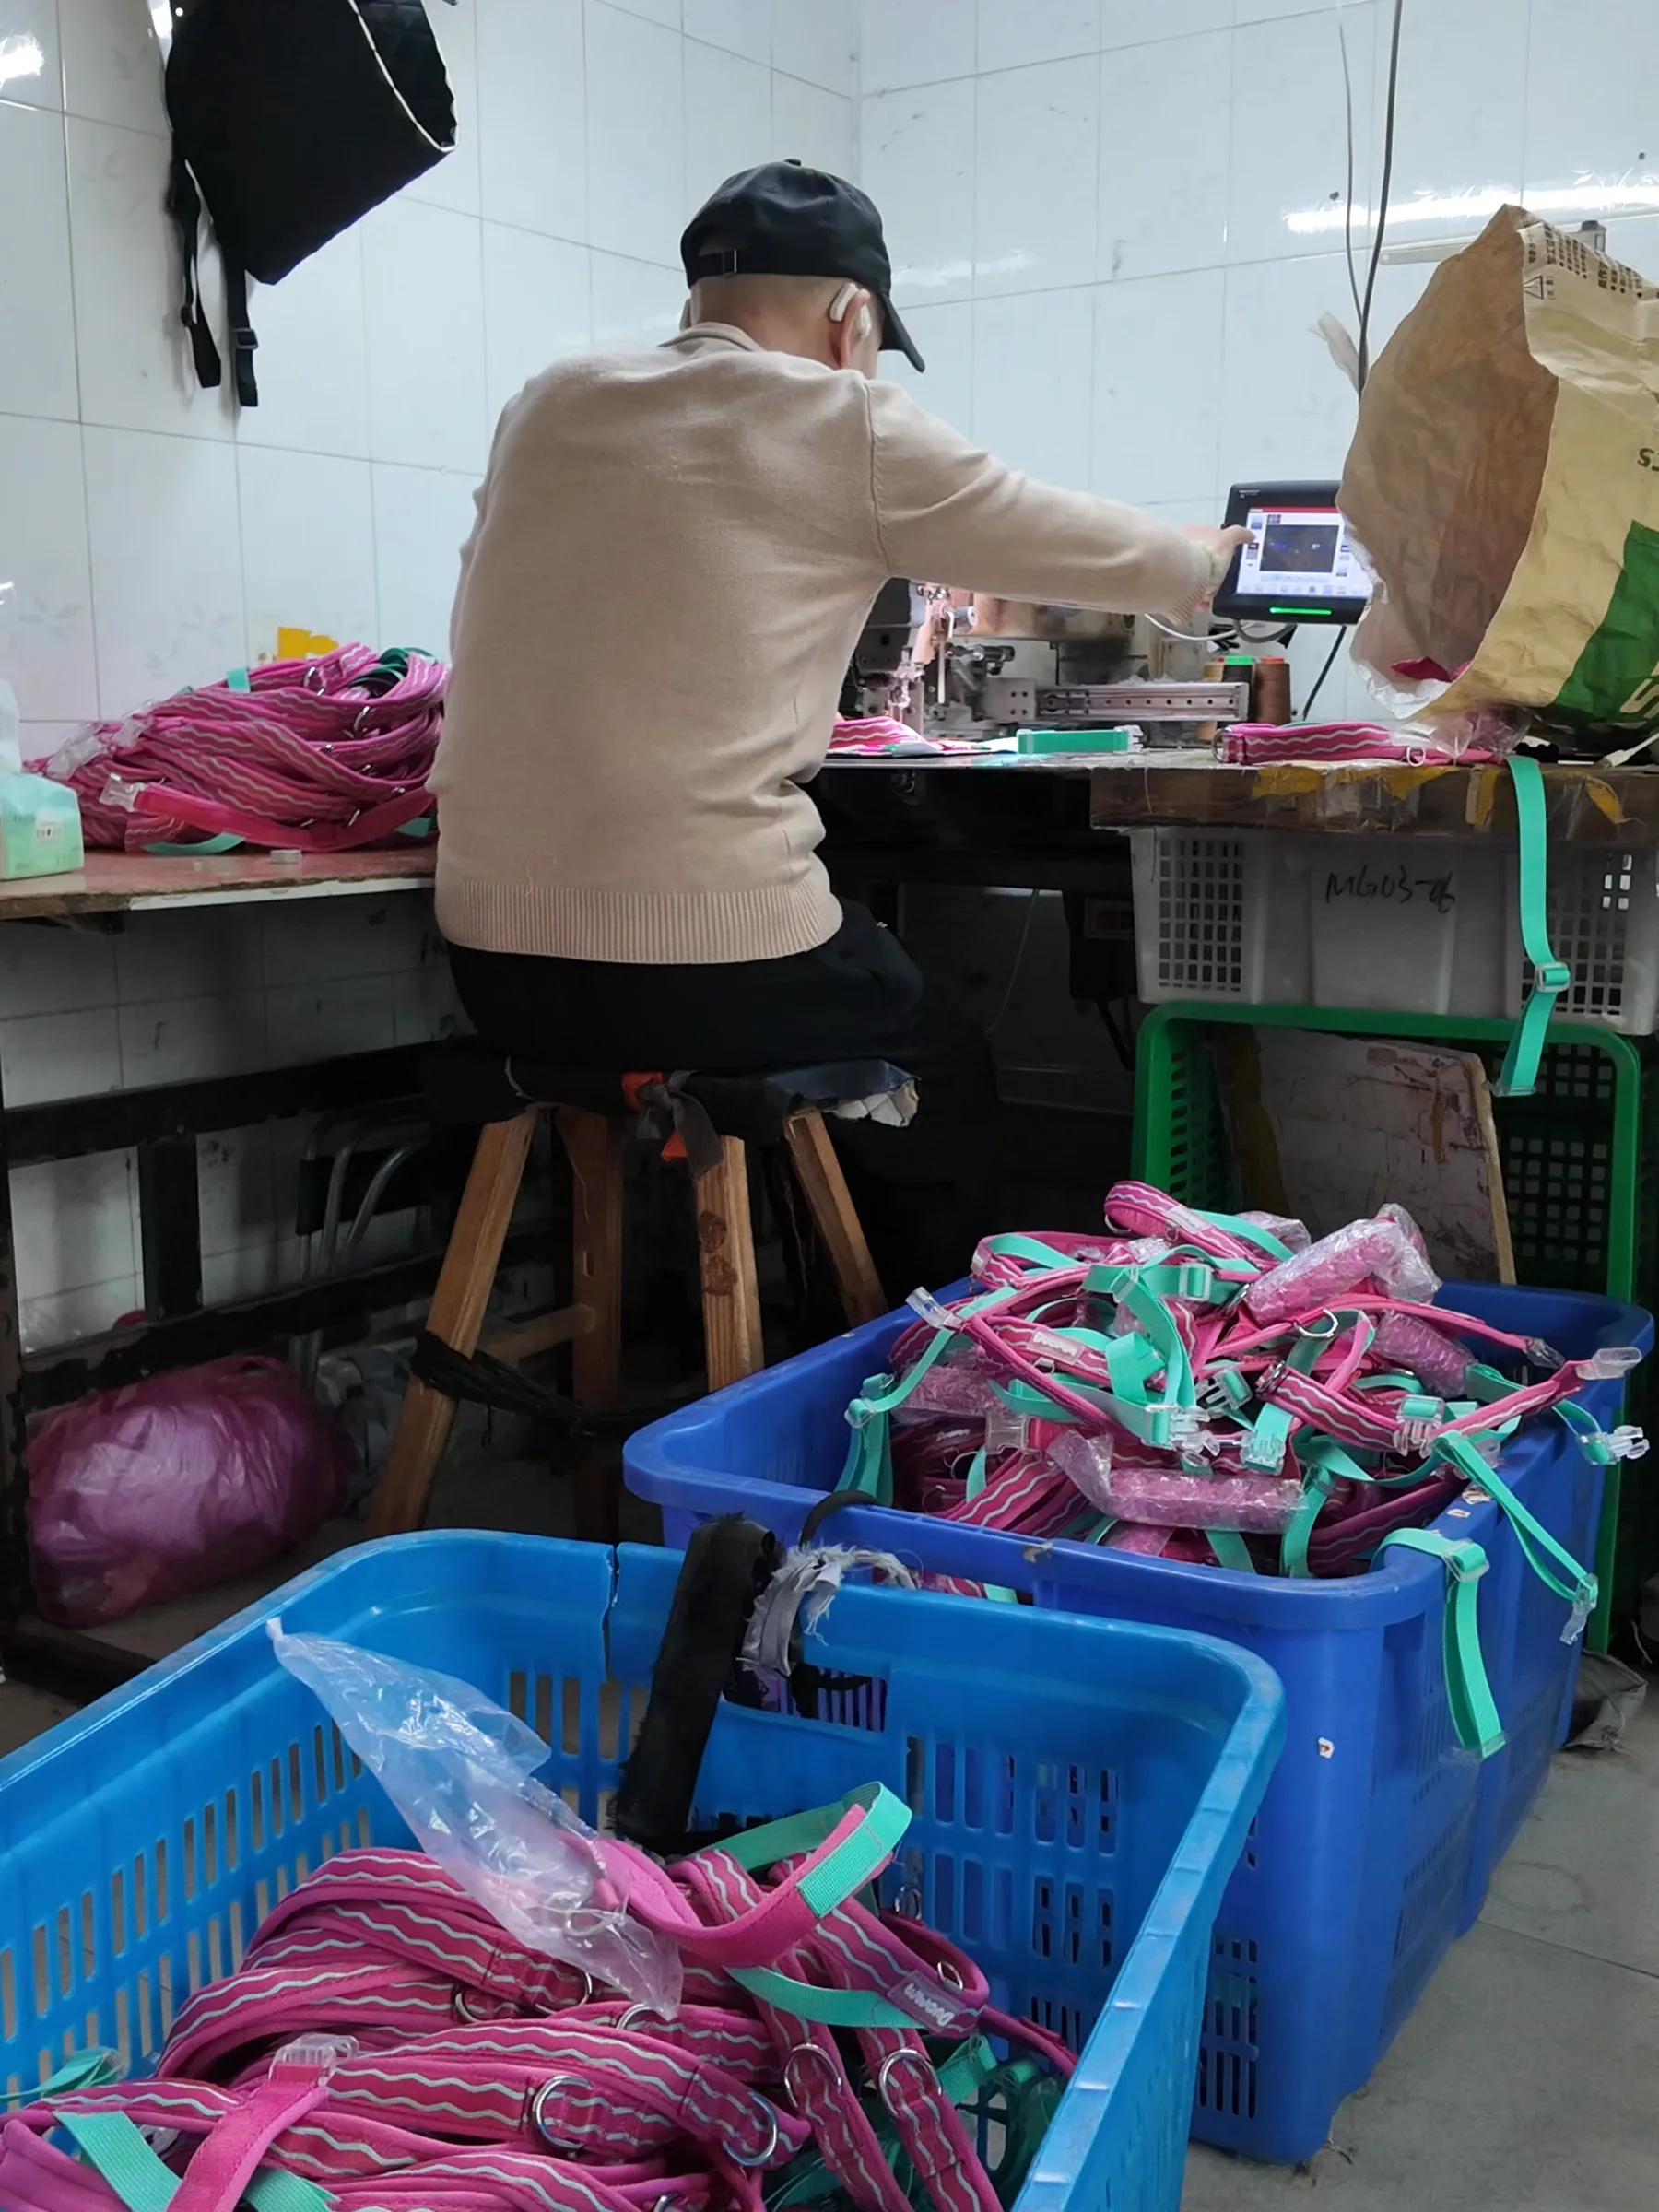
Origin now shapes a quotation as much as price does. Ask every supplier, in writing, which country the goods will be declared from, because duties and any additional measures follow the country of origin, and check the current US tariff schedule for your product before comparing landed costs. Then compare suppliers on the same brief: webbing, hardware, stitch pattern, size run and inspection. Catidog makes these products in China at a typical 100–500 units per product and names the producing facility in each quotation.
US imports under HS 4201: total and share by origin
| Period | US imports (US$ m) | China | Cambodia | Vietnam | India |
|---|---|---|---|---|---|
| 2019 | 523.0 | 64.8% | 0.5% | 4.4% | 7.8% |
| 2020 | 526.7 | 59.0% | 1.7% | 8.0% | 7.7% |
| 2021 | 767.4 | 53.3% | 6.6% | 9.0% | 8.9% |
| 2022 | 815.9 | 48.7% | 7.7% | 12.9% | 9.6% |
| 2023 | 578.2 | 41.5% | 8.2% | 13.9% | 10.0% |
| 2024 | 590.6 | 35.6% | 12.8% | 18.2% | 9.6% |
| 2025 | 513.1 | 25.9% | 20.0% | 18.1% | 11.1% |
| Jan–Jul 2026 | 283.6 | 25.5% | 18.3% | 18.2% | 9.7% |
Products in this customs heading.
No-pull dog harness — materials, customization and sample checks Standard dog leash — materials, customization and sample checks Adjustable webbing collar — materials, customization and sample checks Dog winter coat — materials, customization and sample checksSources and research context
Figures are official trade statistics as reported to UN Comtrade. Totals and shares are our calculation from those records; no raw records are republished.
- United Nations Statistics Division · UN Comtrade Database · HS 4201, imports reported by the USA, by partner: annual 2019–2025 and monthly January–July 2025 and 2026 (retrieved 9 October 2026)
- Japan Customs · Tariff schedule as of 1 April 2026, chapter 42: heading 42.01, “Saddlery and harness for any animal”
TURN THE ANSWER INTO AN OEM BRIEF